M. Grilli, S. Hickel, N.A. Adams (2013)
International Journal of Heat and Fluid Flow 42: 79-93. doi: 10.1016/j.ijheatfluidflow.2012.12.006
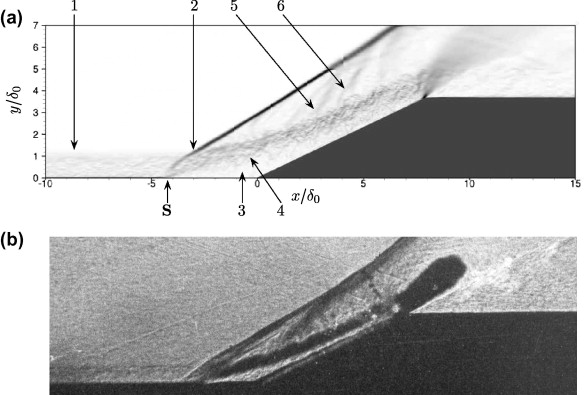
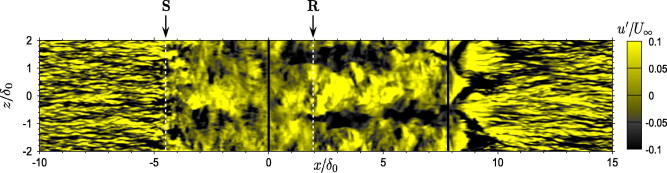
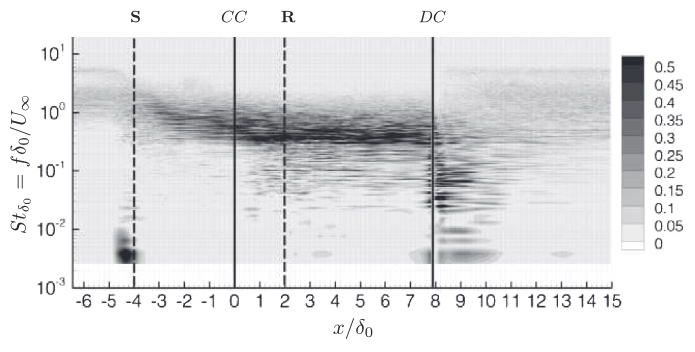
Results of a large-eddy simulation (LES) of a supersonic turbulent boundary layer flow along a compression–expansion ramp configuration are presented. The numerical simulation is directly compared with an available experiment at the same flow conditions. The compression–expansion ramp has a deflection angle of β = 25°, the free-stream Mach number is Ma∞ = 2.88, and the Reynolds number based on the incoming boundary layer thickness is Reδ = 132 840.
The Navier Stokes equations for compressible flows are solved on a cartesian collocated grid. About 32.5 × 10⁶ grid points are used to discretize the computational domain. Subgrid scale effects are modeled implicitly by the adaptive local deconvolution method (ALDM). A synthetic inflow-turbulence technique is used, which does not introduce any low frequency into the domain, therefore avoiding any possible interference with the shock/boundary layer interaction system. Statistical samples are gathered over 800 characteristic time scales δ0/U∞. The numerical data are in good agreement with the experiment in terms of mean surface-pressure distribution, skin-friction, mean velocity profiles, velocity and density fluctuations. For the first time the full compression–expansion ramp configuration was taken into account. The computational results confirm theoretical and experimental findings on fluctuation-amplification across the shockwave/boundary layer interaction region and on turbulence damping through the interaction with rarefaction waves. The LES provide evidence of the existence of Görtler-like structures originating from the recirculation region and traveling downstream along the ramp. An analysis of the wall pressure field clearly shows the presence of a low frequency motion of the shock and strong influence of the Görtler-like vortices on the wall pressure spectra.