We present and evaluate a detailed multi-species two-phase thermodynamic equilibrium model for large-eddy simulations (LES) of liquid-fuel injection and mixing at high pressure. The model can represent the coexistence of supercritical states and multi-component subcritical two-phase states.
LES results for the transcritical Spray A of the Engine Combustion Network (ECN) are found to agree very well to available experimental data. We also address well-known numerical challenges of trans- and supercritical fluid mixing and compare a fully conservative formulation to a quasi conservative formulation of the governing equations. Our results prove physical and numerical consistency of both methods on fine grids and demonstrate the effects of energy conservation errors associated with the quasi conservative formulation on typical LES grids.
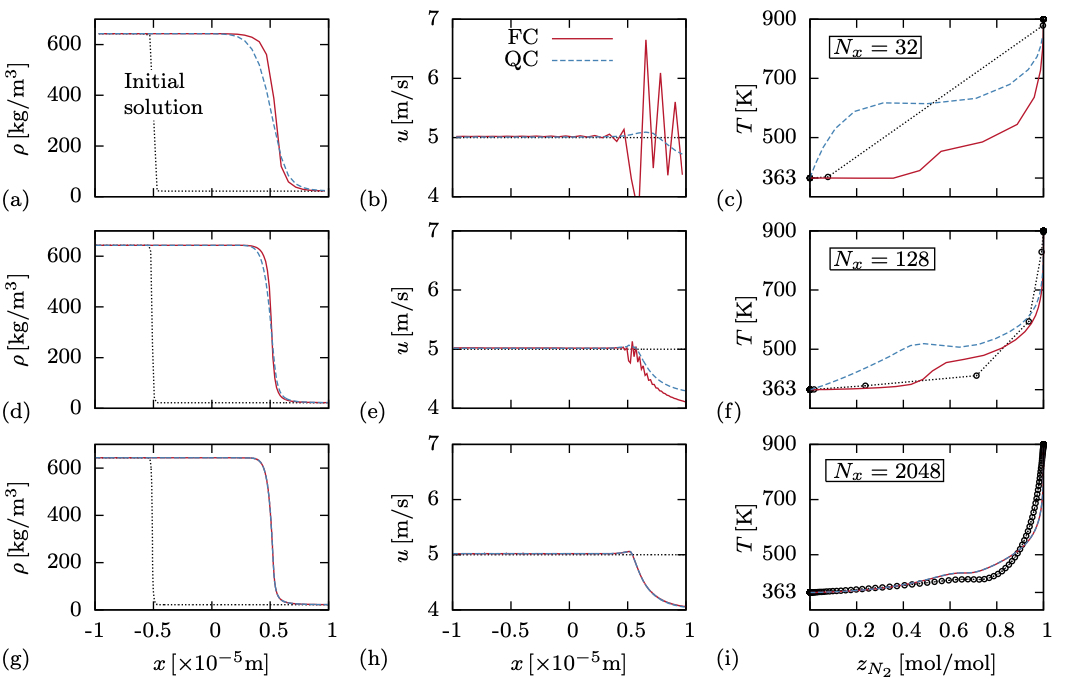
FC-F and QC-F results for a 1-D advection-diffusion test case for different grid resolutions. Left column: density profiles in physical space; center column: velocity profiles in physical space; right column: temperature profiles in mixture space; dotted lines are the initial profiles. In under-resolved simulations, the FC method shows unphysical velocity oscillations, whereas the QC method yields smooth profiles. Note that physical diffusion causes a change in velocity on the right side of the advected contact discontinuity. The QC method shows much higher temperatures on the dodecane side (left) compared to the FC method. With increasing grid resolution, spurious oscillations of the FC method become less severe and eventually disappear, and the temperature pro- file of the QC method converges towards the FC solution. We conclude from these results that energy conservation errors – necessary to maintain velocity and pressure equilibria at interfaces without the generation of spurious oscillations – translate into errors in temperature on coarse grids and that both methods converge to the same solution on sufficiently fine grids. For typical LES grid resolutions, the energy conservation error of the QC method is non-negligible.
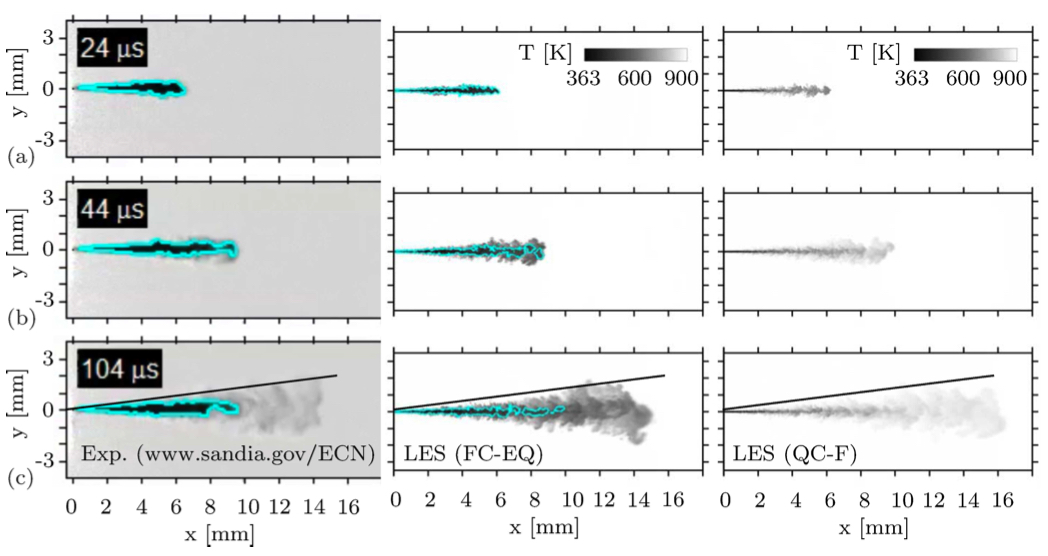
Results for ECN Spray A: Temporal sequence of the injection event. Left column: experimental data of Pickett et al. (2011); center column: LES with FC-EQ; right column: LES with QC-F. Liquid penetration length is illustrated by a LVF = 0.15% iso-contour.
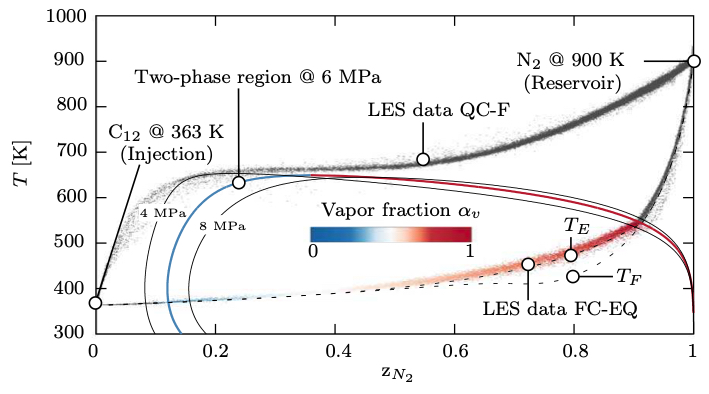
Results for ECN Spray A: Temperature-composition diagram for a N2 − C12H26 mixture with frozen (TF ) and equilibrium (TE) mixing temperature. Scattered data depict the thermodynamic states that are obtained in the QC-F and FC-EQ LES at 144 μs. For FC-EQ, points within the two-phase region are colored by vapor volume fraction.
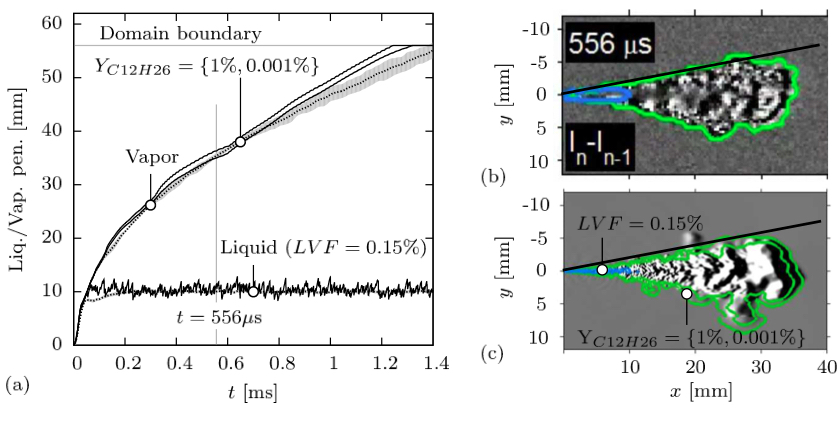
Results for ECN Spray A: (a) Numerical (solid lines) and experimental (dotted lines) liquid and vapor penetration trajectories. (b) Experimental schlieren image. (c) Numerical schlieren image for FC-EQ LES.
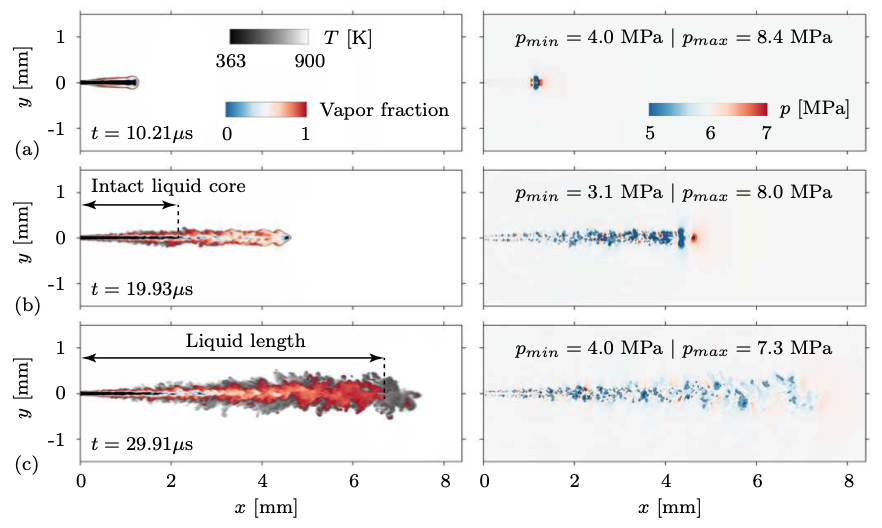
Results for ECN Spray A: Temporal sequence of temperature (left) and pressure (right) for FC-EQ LES.