V.K. Tritschler, A. Avdonin, S. Hickel, X.Y. Hu, N.A. Adams (2014)
Physics of Fluids 26: 026101. doi: 10.1063/1.4865756
We quantify initial-data uncertainties on a shock accelerated heavy-gas cylinder by two-dimensional well-resolved direct numerical simulations. A high-resolution compressible multicomponent flow simulation model is coupled with a polynomial chaos expansion to propagate the initial-data uncertainties to the output quantities of interest.
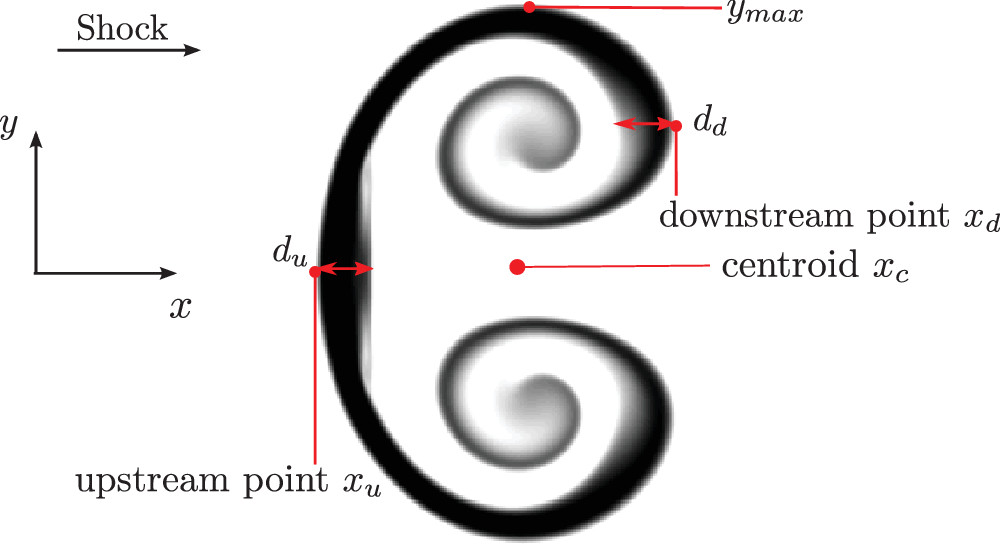
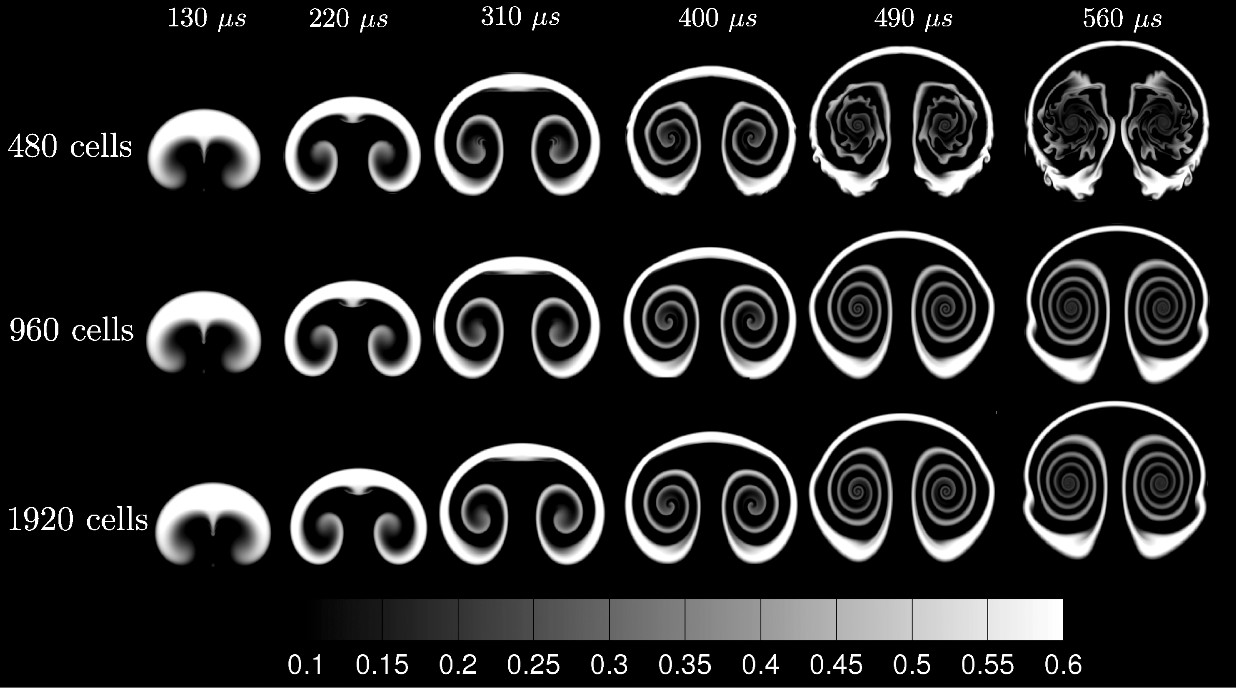
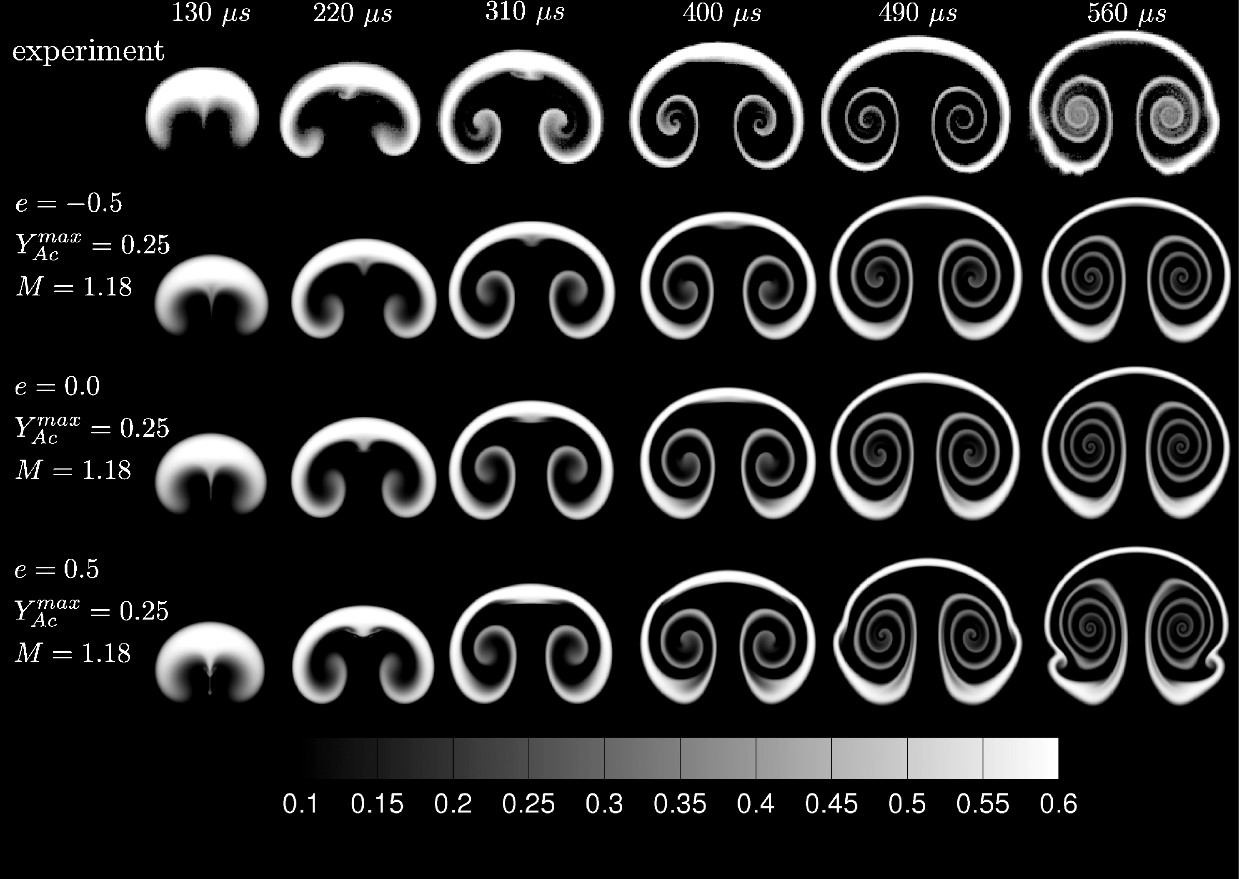
The initial flow configuration follows previous experimental and numerical works of the shock accelerated heavy-gas cylinder. We investigate three main initial-data uncertainties, (i) shock Mach number, (ii) contamination of SF6 with acetone, and (iii) initial deviations of the heavy-gas region from a perfect cylindrical shape. The impact of initial-data uncertainties on the mixing process is examined.
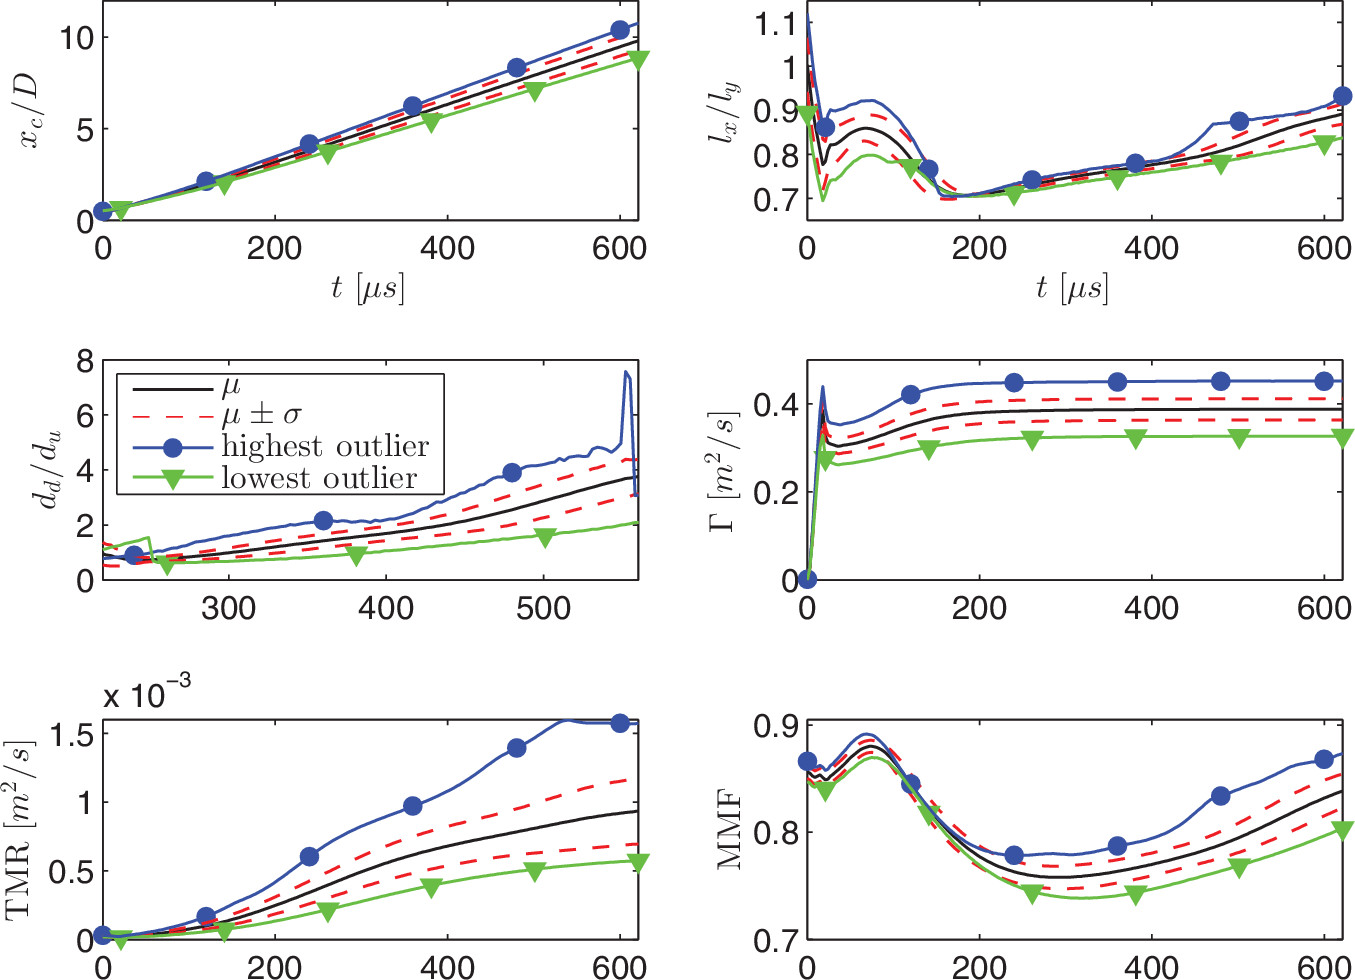
The results suggest that the mixing process is highly sensitive to input variations of shock Mach number and acetone contamination. Additionally, our results indicate that the measured shock Mach number in the experiment of Tomkins et al. [“An experimental investigation of mixing mechanisms in shock-accelerated flow,” J. Fluid. Mech. 611, 131 (2008)] and the estimated contamination of the SF6 region with acetone [S. K. Shankar, S. Kawai, and S. K. Lele, “Two-dimensional viscous flow simulation of a shock accelerated heavy gas cylinder,” Phys. Fluids 23, 024102 (2011)] exhibit deviations from those that lead to best agreement between our simulations and the experiment in terms of overall flow evolution.