F. Diegelmann, S. Hickel, N.A. Adams (2017)
Combustion and Flame 181: 1339-1351. doi: 10.1016/j.combustflame.2017.03.026
We investigate a reacting shock–bubble interaction through three-dimensional numerical simulations with detailed chemistry. The convex shape of the bubble focuses the shock and generates regions of high pressure and temperature, which are sufficient to ignite the diluted stoichiometric H2-O2 gas mixture inside the bubble. We study the interaction between hydrodynamic instabilities and shock-induced reaction waves at a shock Mach number of Ma = 2.83.
The chosen shock strength ignites the gas mixture before the shock-focusing point, followed by a detonation wave, which propagates through the entire bubble gas. The reaction wave has a significant influence on the spatial and temporal evolution of the bubble. The misalignment of density and pressure gradients at the bubble interface, caused by the initial shock wave and the subsequent detonation wave, induces Richtmyer–Meshkov and Kelvin–Helmholtz instabilities. The growth of the instabilities is highly affected by the reaction wave, which significantly reduces mixing compared to an inert shock–bubble interaction. A comparison with two-dimensional simulations reveals the influence of three-dimensional effects on the bubble evolution, especially during the late stages. The numerical results reproduce experimental data in terms of ignition delay time, reaction wave speed and spatial expansion rate of the bubble gas. We observe only a slight divergence of the spatial expansion in the long-term evolution.
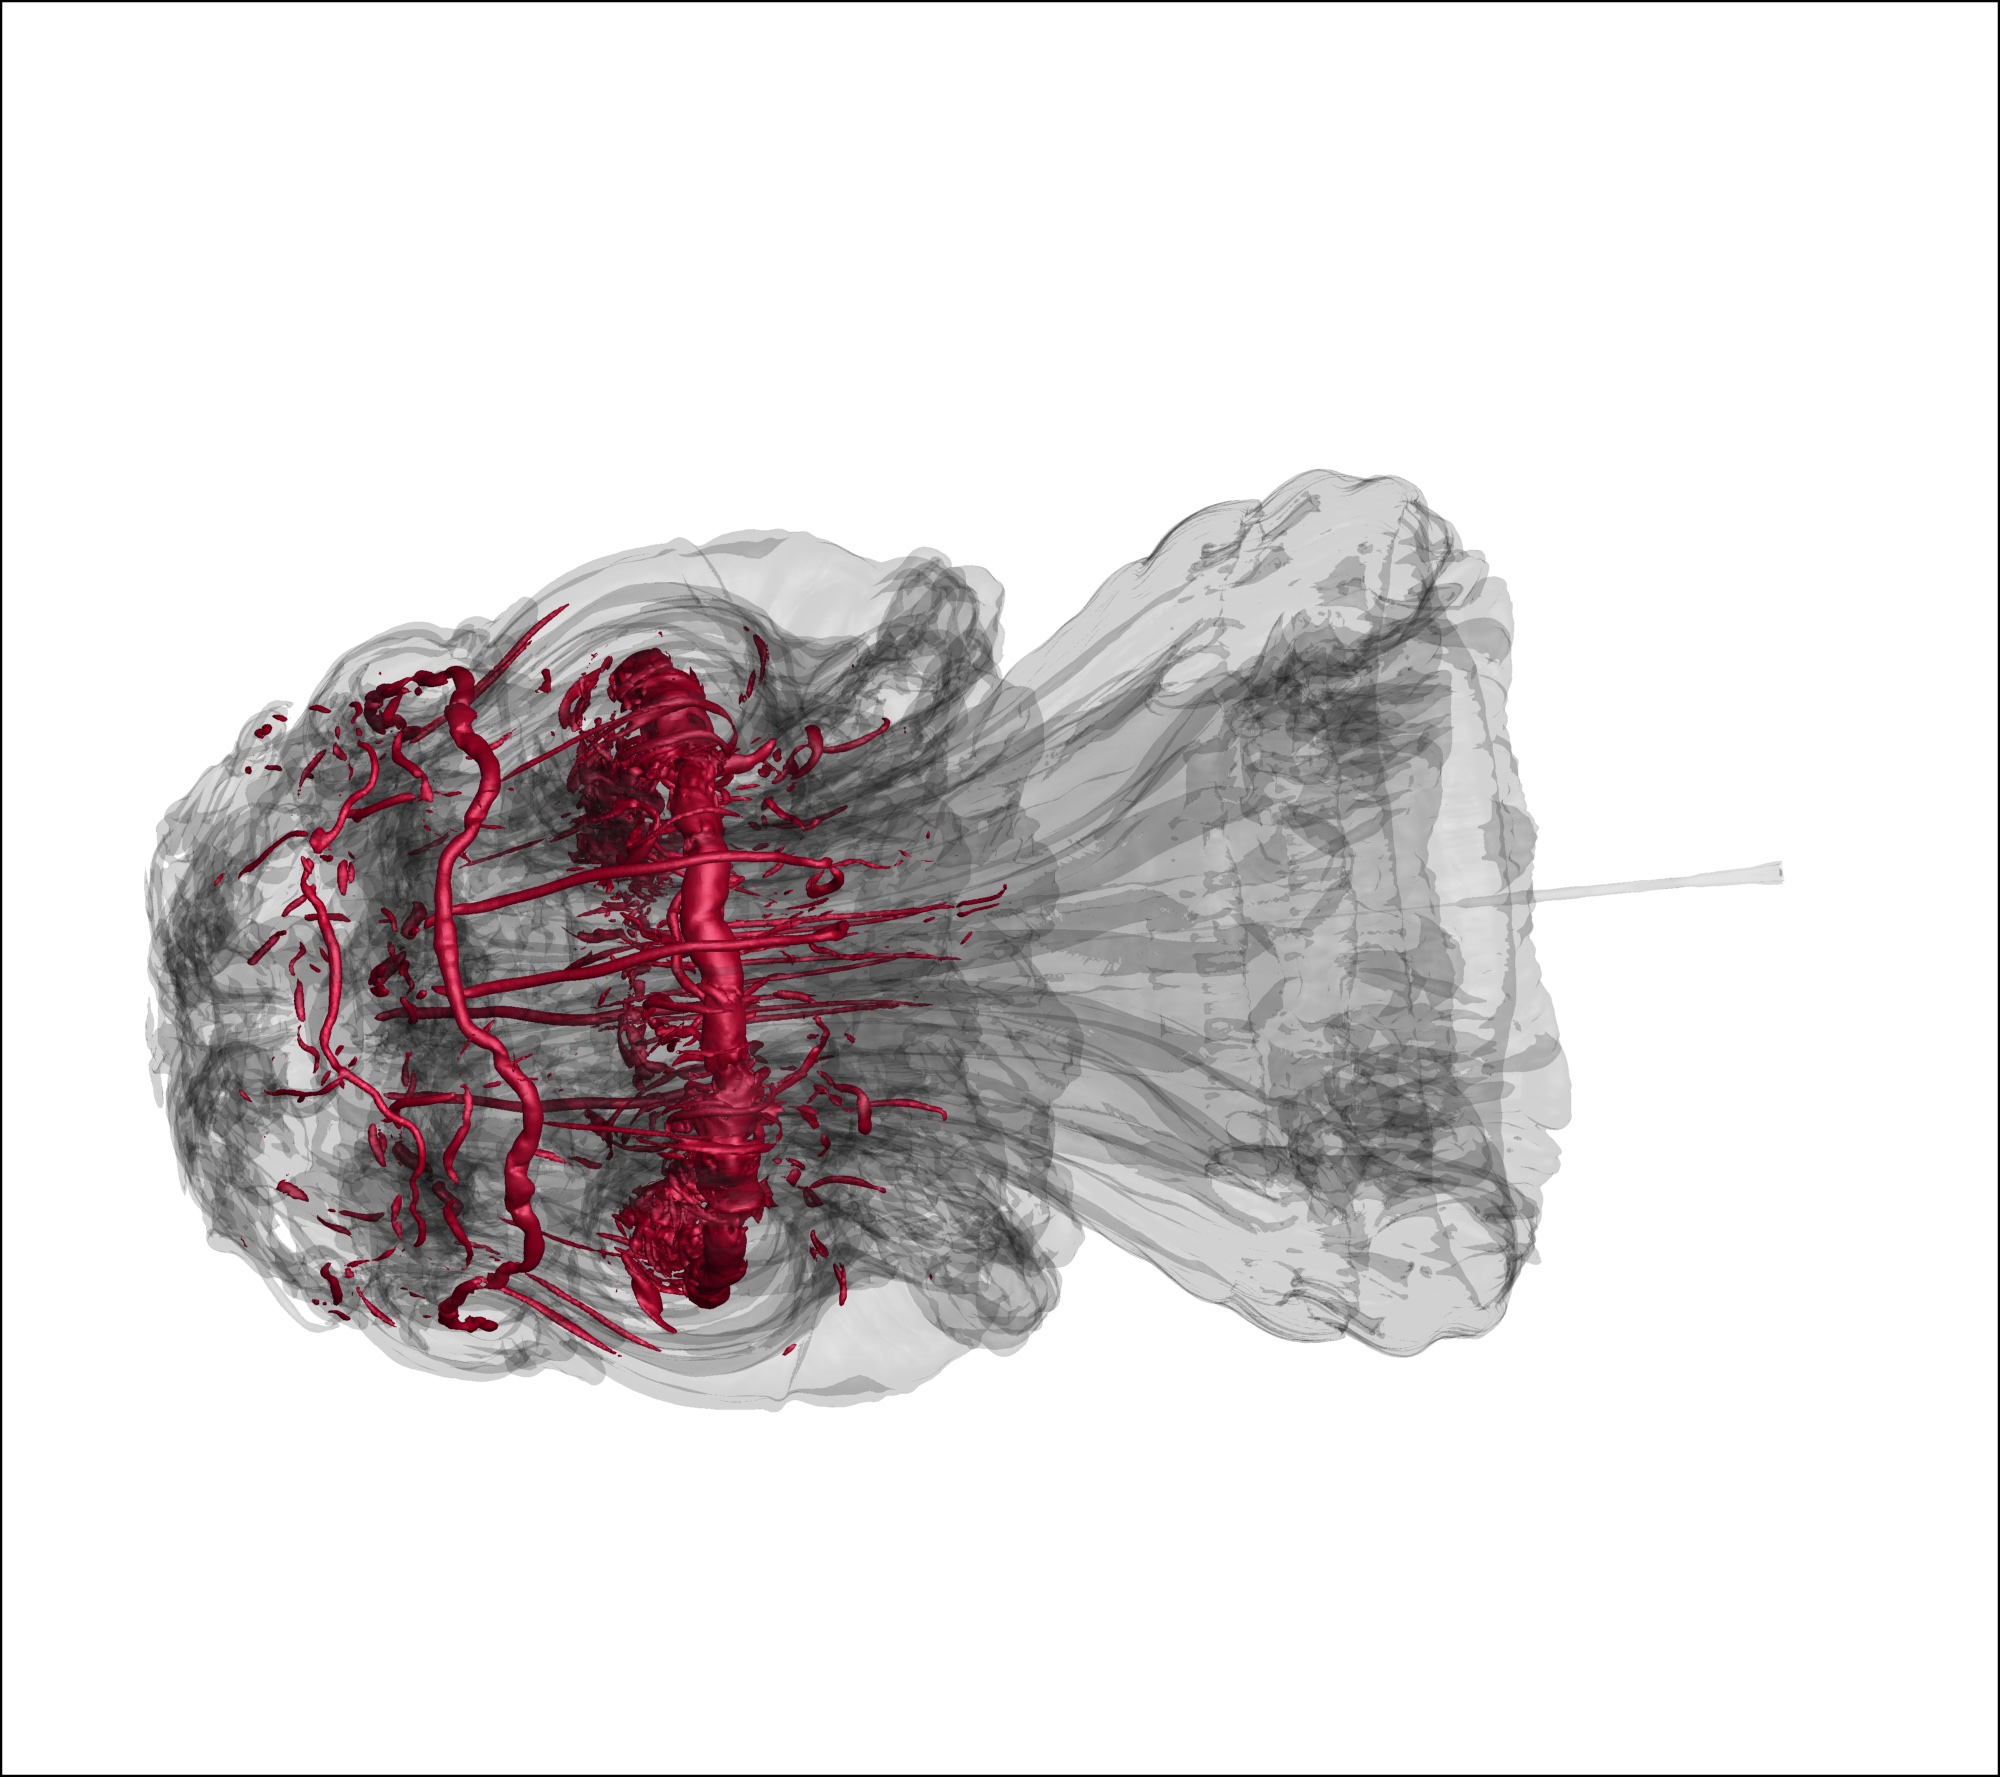
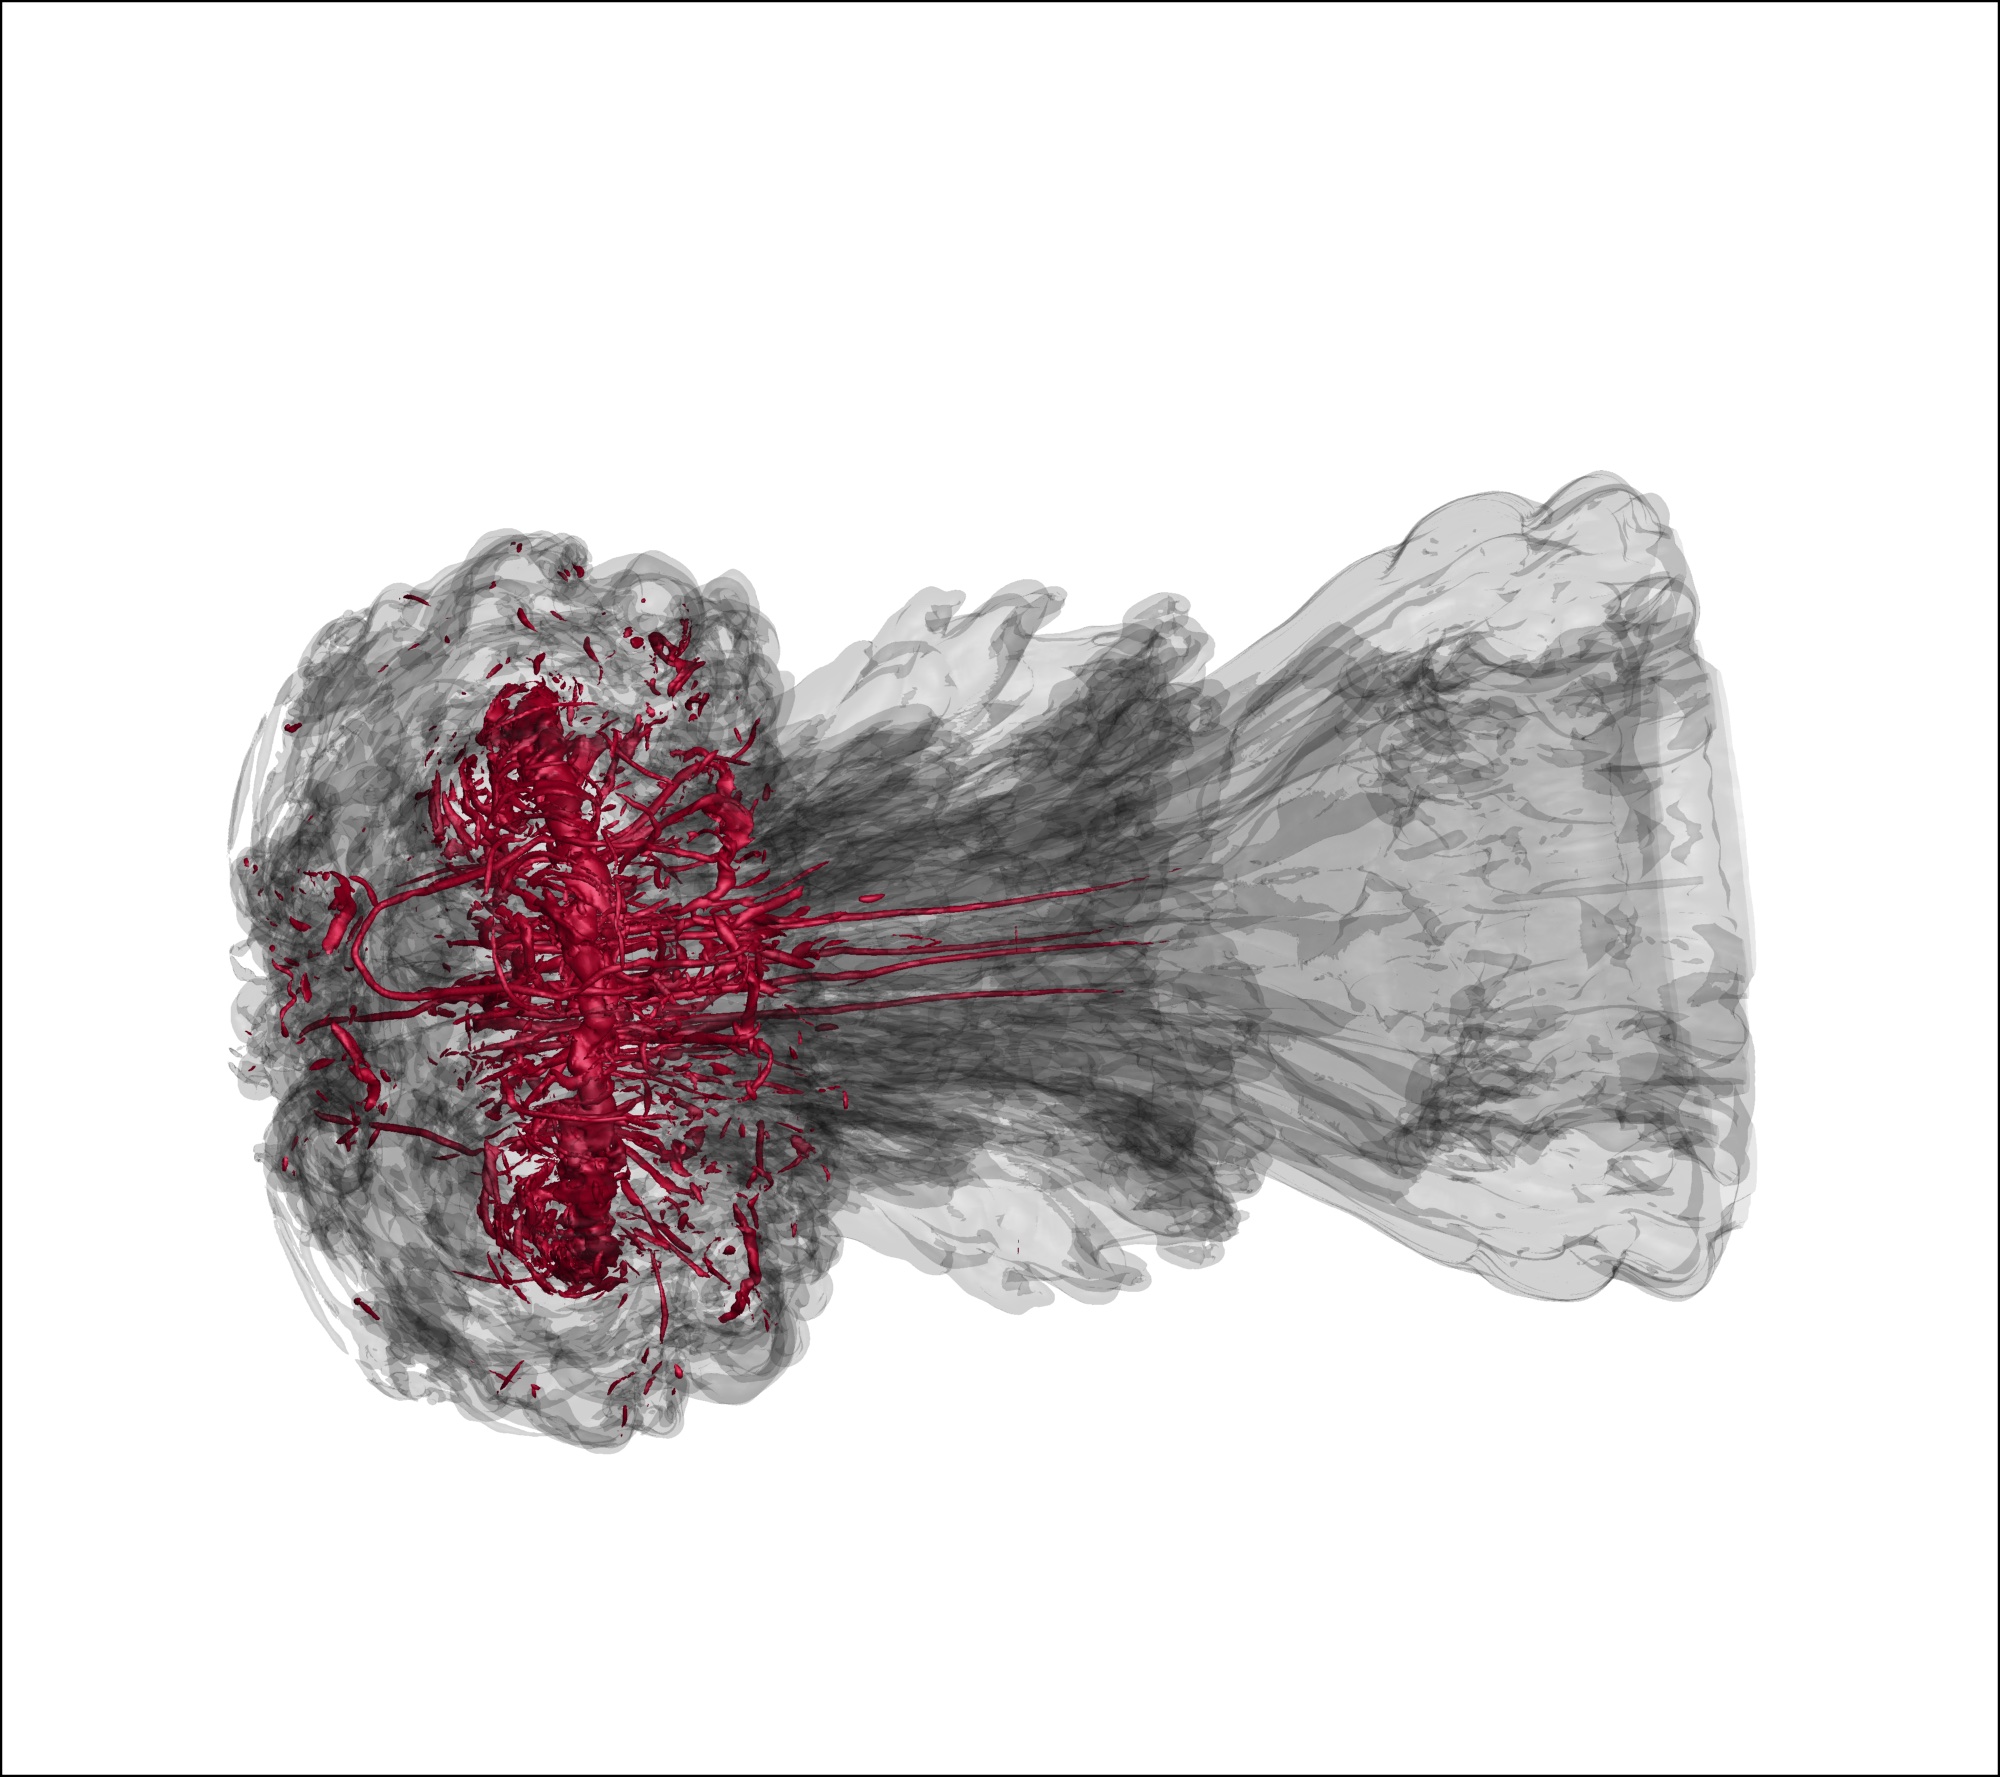
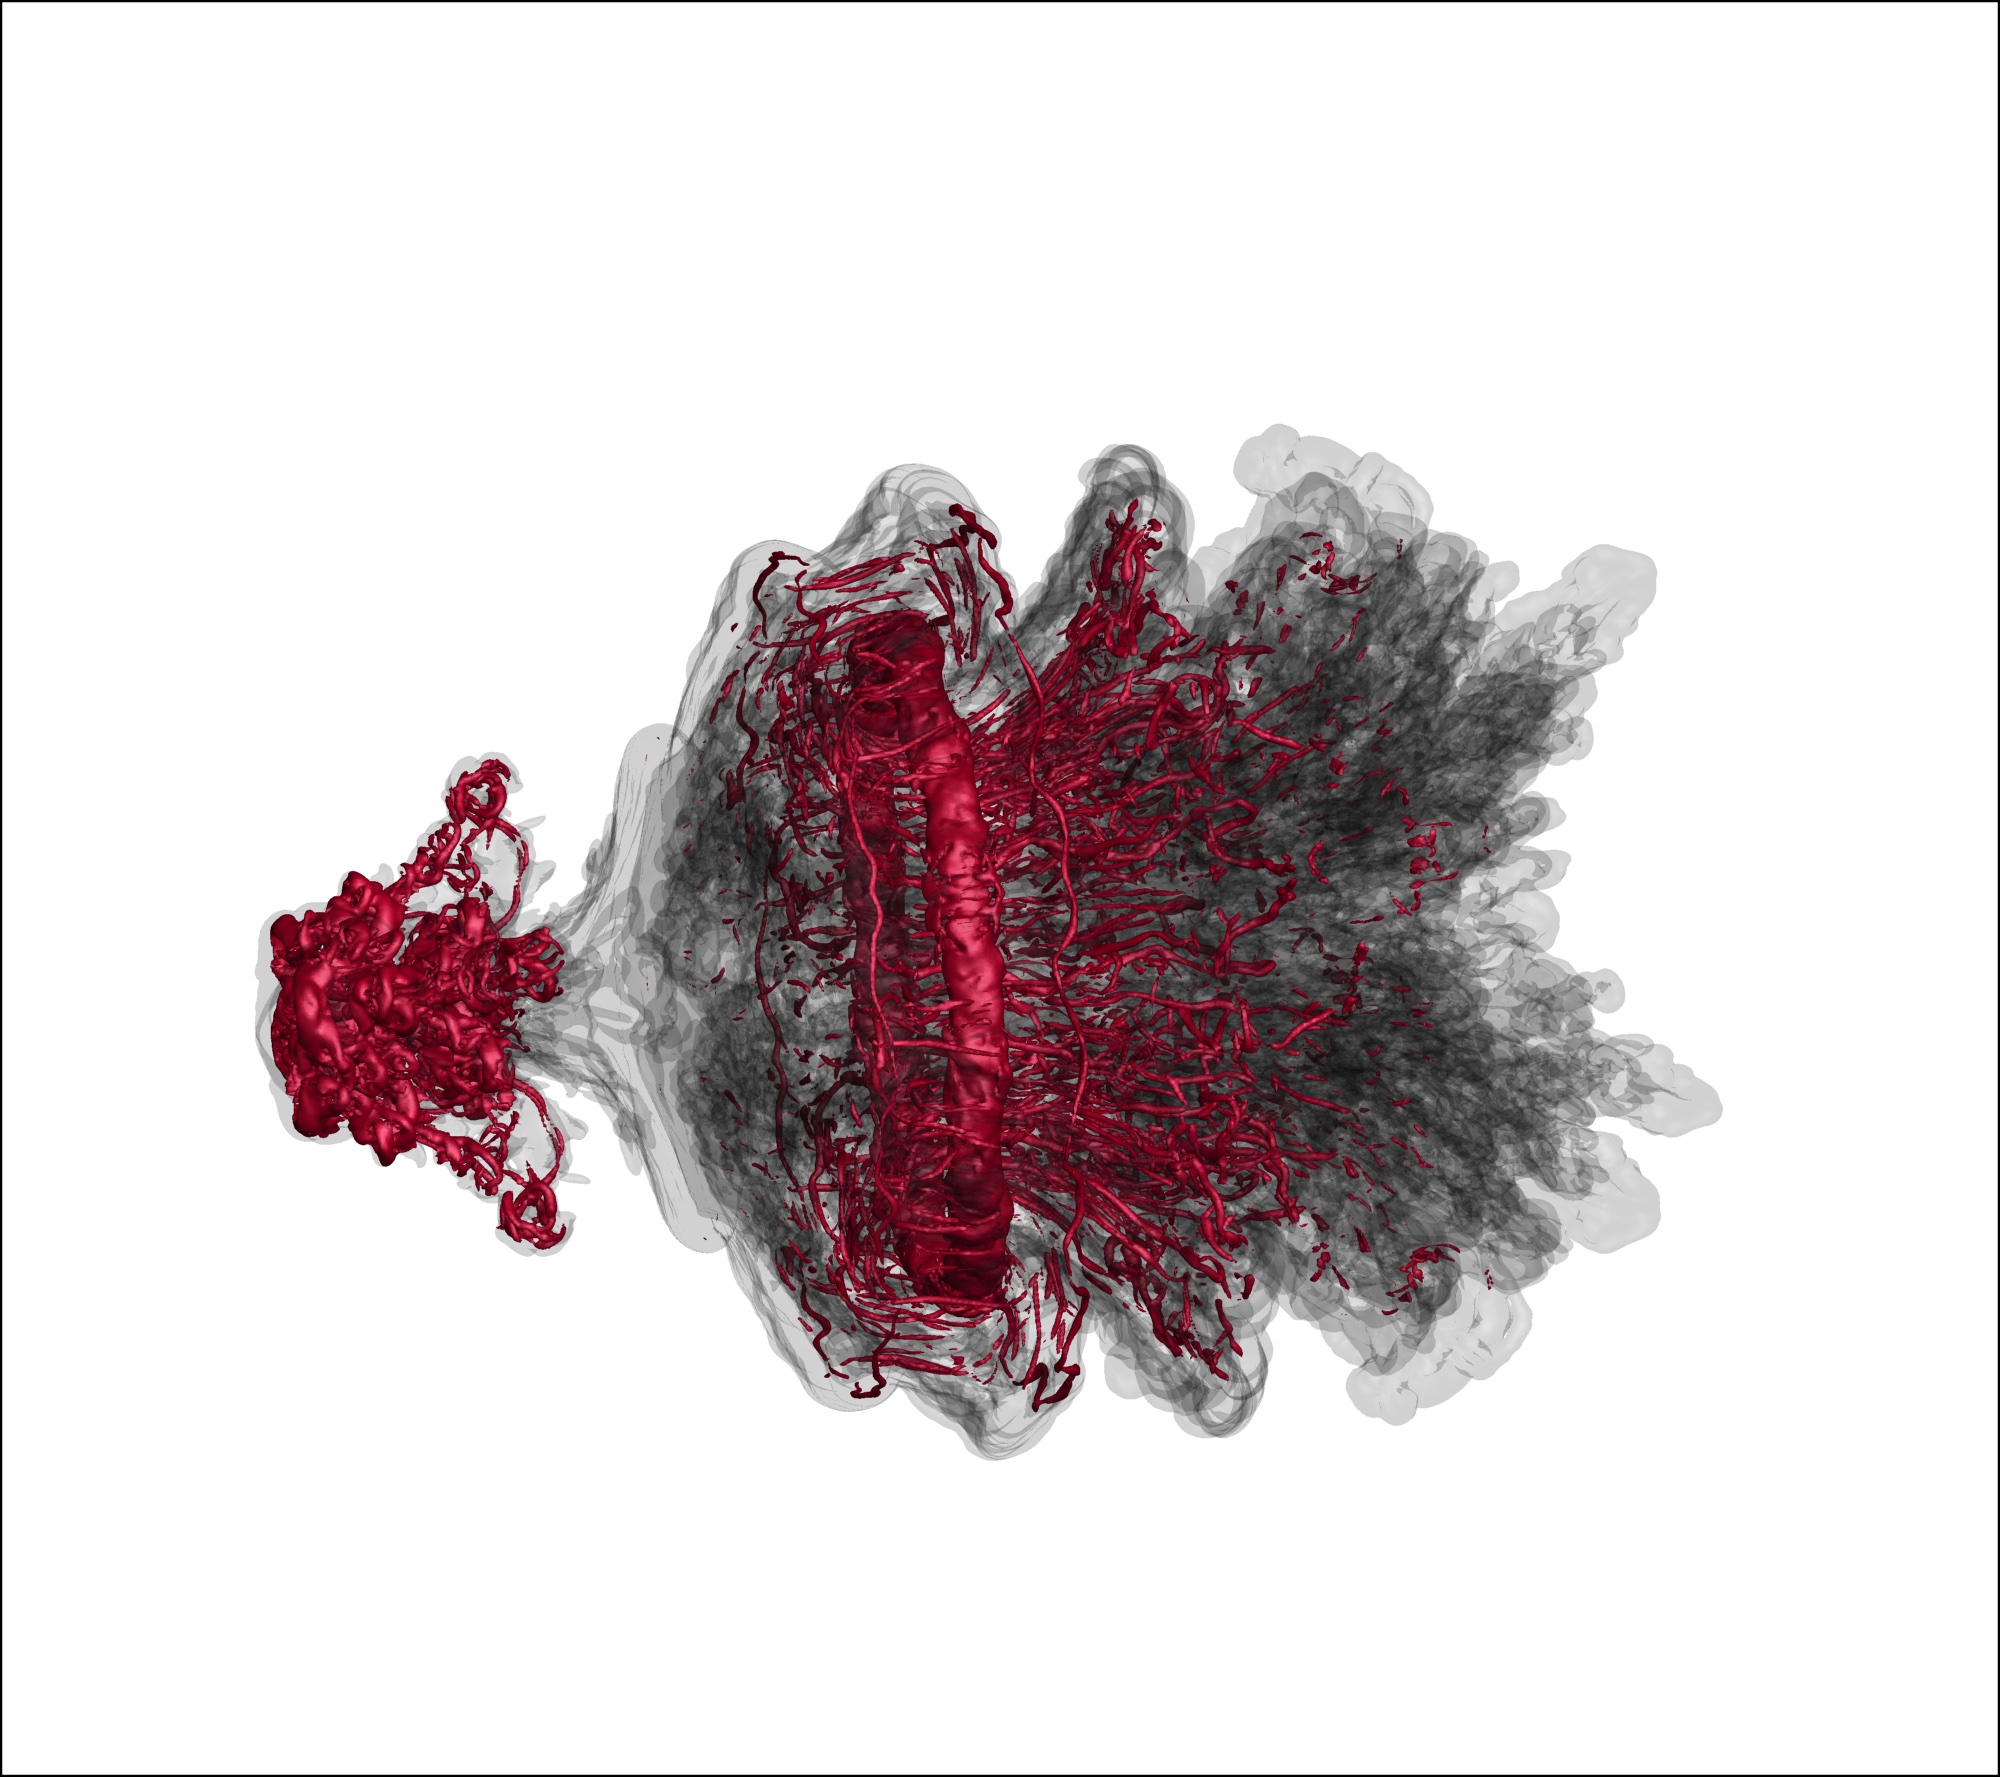
Inert shock bubble interaction
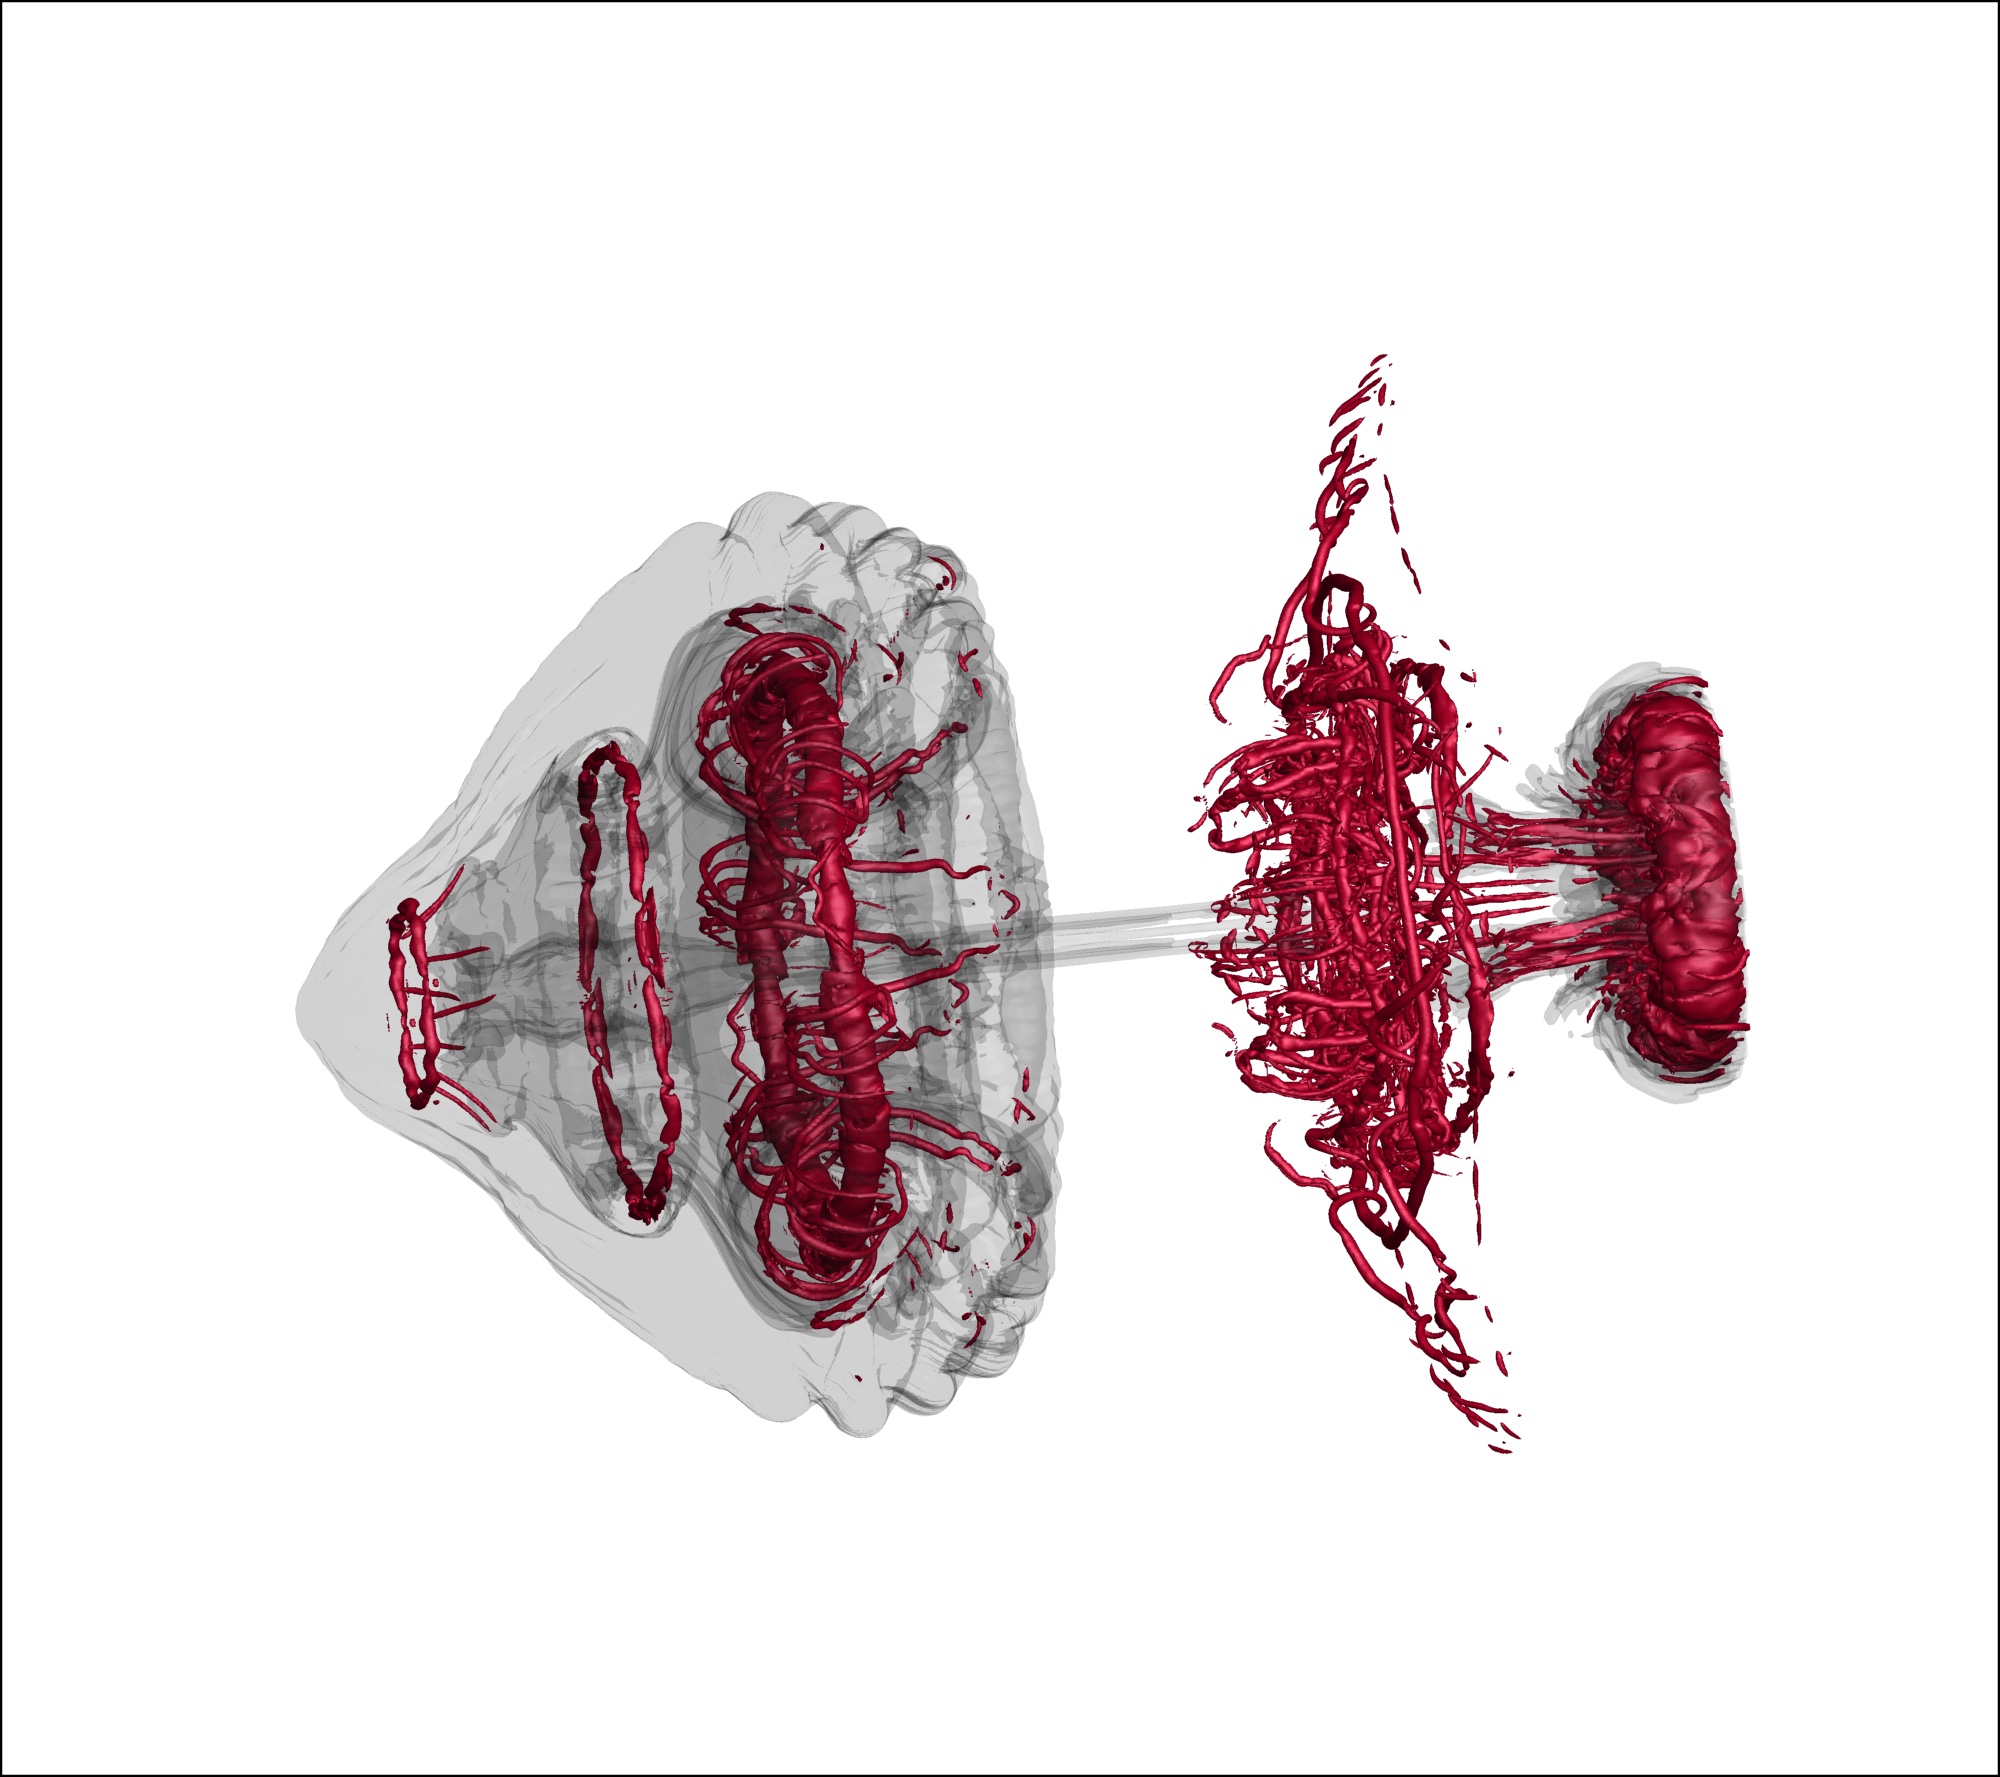
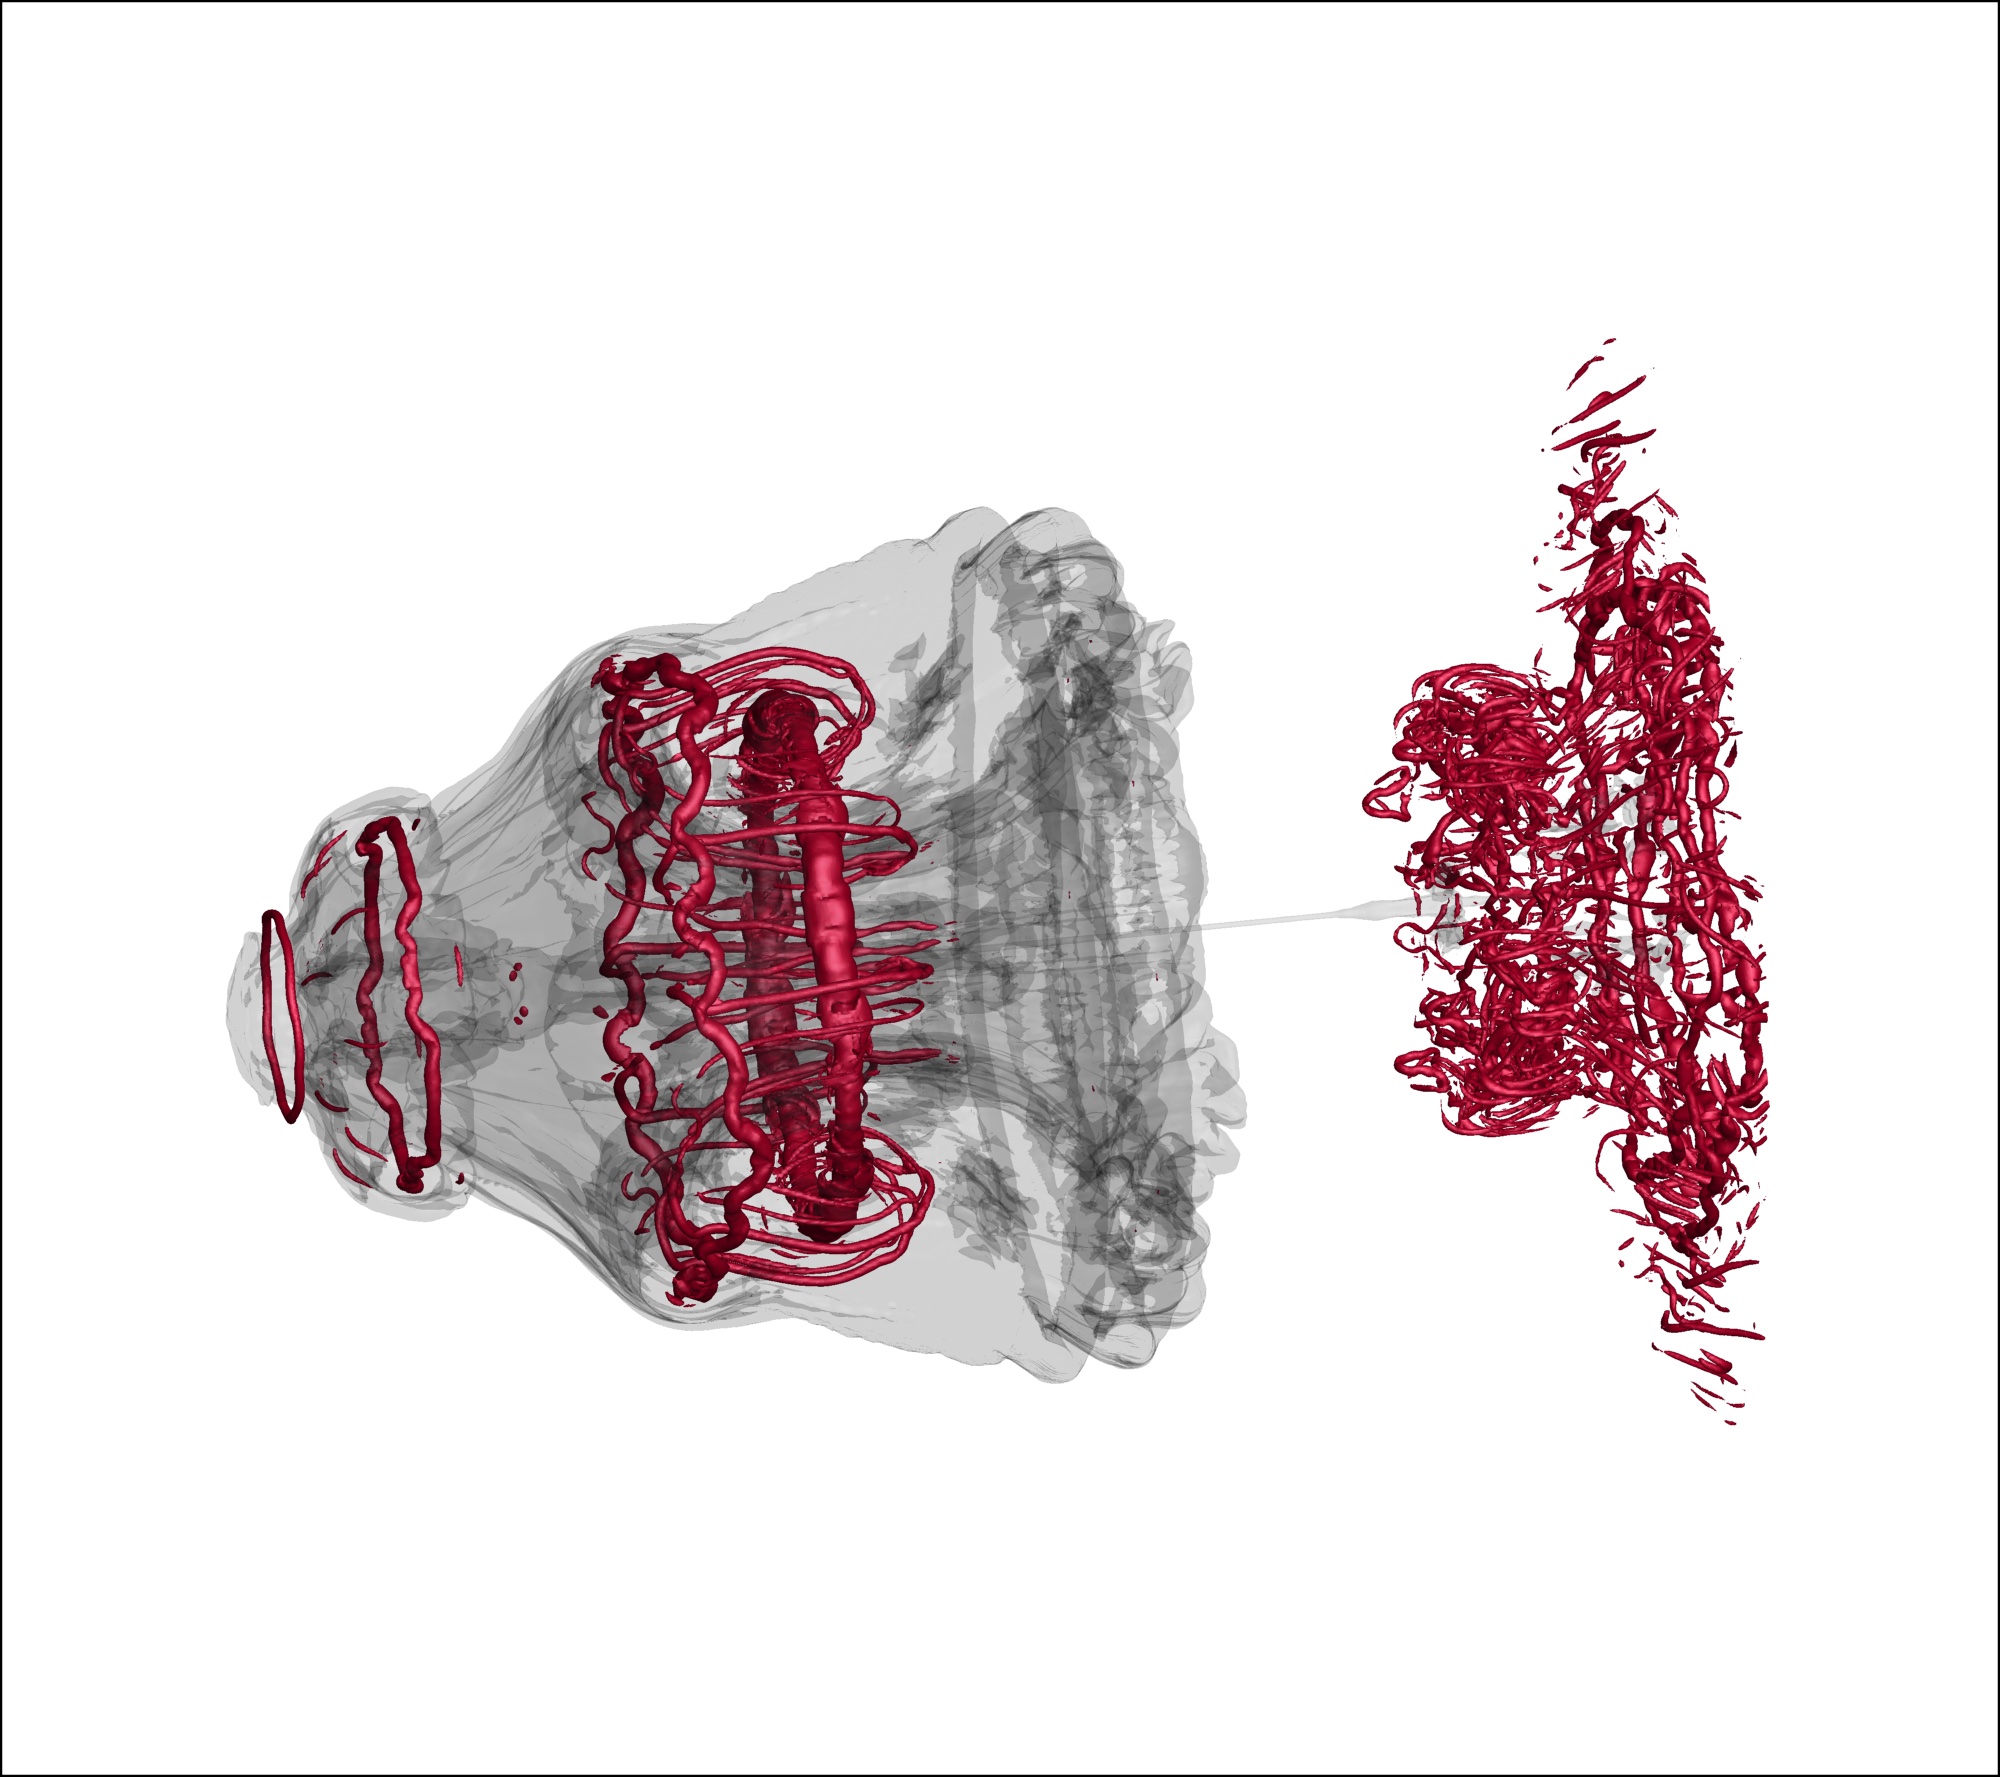
Below you find beautiful visualizations of an inert shock-bubble interaction. In all figures, the mass fraction of the bubble tracer gas Xenon is shown in gray and the red iso-surfaces visualize vortex structures.
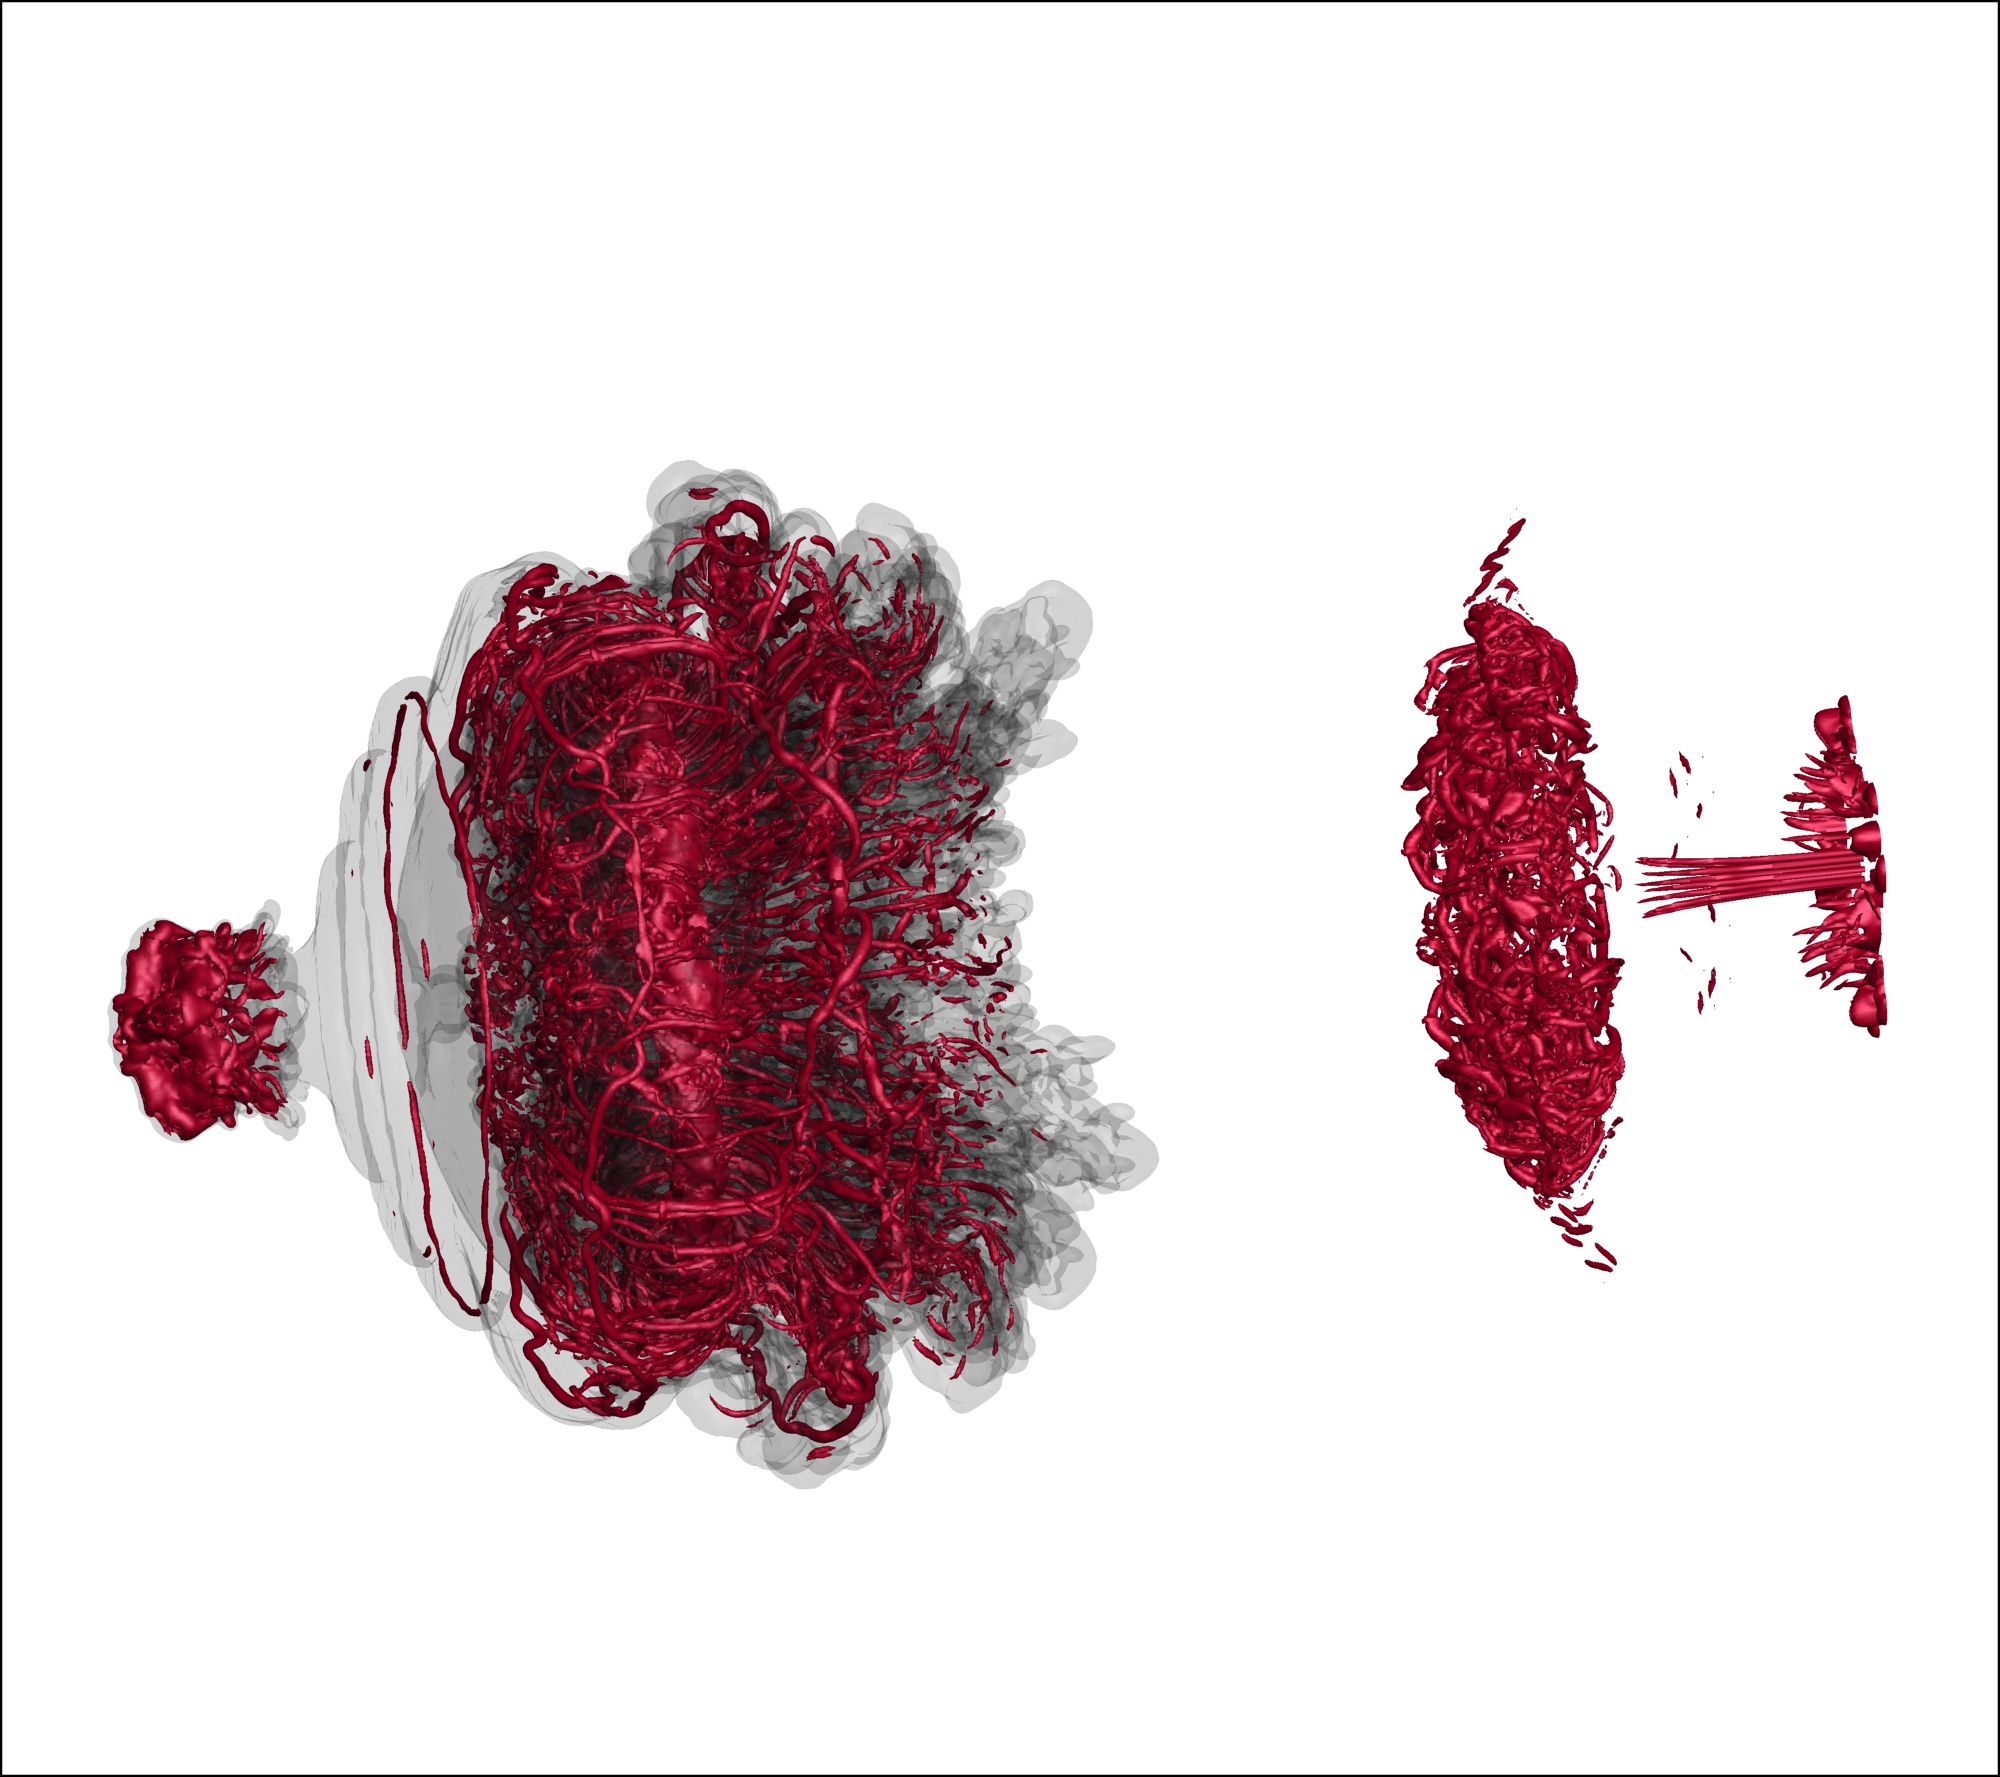
Reacting shock bubble interaction
Below you find beautiful visualizations of a chemically reacting shock-bubble interaction. In all figures, the mass fraction of the bubble tracer gas Xenon is shown in gray and the red iso-surfaces visualize vortex structures. Compared to the inert case shown above, which is characterized by a highly mixed bubble gas with a large number of fine vortex filaments, turbulence is less intense and the vorticity is concentrated within the bubble in form of several distinct vortex rings. A video of this simulation can be found here.